ZF just posted a €2.1 billion loss and put up to 14,000 German jobs on the line. That is not a headline about one company having a rough year. It is the loudest single reading yet on a restructuring wave that is moving through the entire German tier-1 supplier base — the same wave that already produced Bosch's first loss since 2009 and Continental's decision to spin its automotive unit off entirely.
I spent years inside the German automotive supply chain before I left to build a company, and I have watched this coming from inside the machinery. What follows is the honest version of what the ZF numbers actually mean — the cause, the timeline, who is structurally next, and what the whole wave signals for anyone whose revenue depends on this industry.
What actually happened at ZF — and why the number is €2.1B, not a fluke
ZF reported a net loss of around €2.1 billion for fiscal year 2025. It is worth being precise about where that number comes from, because the precision is the whole point. The loss was driven largely by one-off write-downs on unprofitable projects — an accounting effect, not a collapse in day-to-day operations. Reported group sales were down roughly 11% year over year. On the surface, then, a one-time hit.
- The write-down is real, and it is a signal. You only write down platforms and projects when you have concluded they will not earn back what you put into them. A one-off loss of that scale means a portfolio of programs was quietly judged to be worth far less than the balance sheet claimed.
- The core product is shrinking. ZF's combustion-era driveline and transmission business — the volume that funded the company — is in structural decline. Every year fewer of the mechanical parts that carried the best margins get built.
- The replacement product earns less. Electric and software-defined components are meant to take over, but they carry lower margins, need enormous up-front R&D, and put German suppliers head-to-head with Chinese competitors who move faster and price lower.
A €2.1B write-down is not a story about one bad year. It is a business model built for a world that is ending, finally being forced to mark itself to reality.
The timeline: this is a decade-long wind-down, not a redundancy round
The jobs number is where the restructuring wave shows its true shape. ZF has said it plans to cut up to around 14,000 jobs in Germany, concentrated in its transmission workforce, phased in over the rest of the decade — to roughly 2030. Read that timeline carefully, because it tells you this is not a cost-cutting spasm. It is a planned, multi-year wind-down of an entire product era.
That is the part outsiders miss. A single redundancy round is a reaction to one bad quarter. A five-year, 14,000-role restructuring tied to the decline of combustion driveline demand is a company conceding that the market it was built for will not come back at the scale it needs. When the timeline is measured in years and the trigger is a whole product category, you are not looking at one firm's problem — you are looking at a structural transition being priced in publicly.
Who's next — read the exposure, not the brand
The obvious question after a number like this is "who's next," and the honest answer is that the wave follows structure, not names. The suppliers most exposed are not defined by their logo but by their shape: high fixed cost, margin historically funded by combustion-era driveline and mechanical volume, lower-margin electric and software replacements, and rising Chinese competition on both.
Bosch — first loss since 2009
Continental — automotive unit spun off
One structural squeeze · three of the biggest names · same window.
That is why the three loudest stories of the wave — ZF, Bosch and Continental — are not a coincidence. They share a business model and a customer base, so they hit the wall together. The most useful way to predict the next casualty is not to guess a brand; it is to look for the same exposure profile: combustion-weighted portfolio, high fixed cost, dependence on falling European OEM volume. Wherever those three line up, the restructuring math is the same.
These are the exact stories that, posted plainly on LinkedIn, drew well into six figures of impressions each from inside the industry — because the people living it recognised the pattern immediately. The reach was not the point; the recognition was.
What the wave signals for anyone selling into automotive
If your revenue touches this industry — tools, software, services, talent — the restructuring wave is not background news. It is a change in who buys, how fast, and on what criteria. A supplier writing down billions and shedding thousands of roles does not buy the way it did three years ago.
- Budgets shift from "add feature" to "take out cost." A supplier in restructuring will not pay for incremental nice-to-haves. It will pay for provable cost-out, speed, and leverage. Reposition accordingly or get cut.
- Decision speed changes in both directions. Some programs freeze; others accelerate because the pain is now urgent. Knowing which is which is the whole game.
- Proof beats pitch. Buyers under this much pressure discount claims and reward evidence. "We did X on a real engagement and here is the number" outperforms any feature list.
There is a quieter driver underneath all of this, and it is the one I know best. The German engineering model was built on people — thousands of them, hand-building requirements, hand-tracing code to architecture, hand-assembling the compliance evidence a program demands. That was affordable when volume and margin were high. In a restructuring wave, it is the first cost that gets scrutinised — which is why the founders who win attention in this market right now are the ones naming the structural truth out loud instead of selling around it.
Selling into a market that's being rewritten?
The buyers who feel this wave are already in your LinkedIn engagement — reacting to the posts that name their reality. See where you stand — a free, personalized LinkedIn visibility audit + blueprint in your inbox within 48 hours. No card, no call.
Book a call →Why this post did 188,000 impressions — the anatomy
The story above started as a single LinkedIn post that reached 188,734 people from inside the automotive world. It was not luck, and it was not reach-hacking. It followed a repeatable structure that any technical founder can copy to build pipeline and credibility with VCs and OEMs. Here is the teardown.
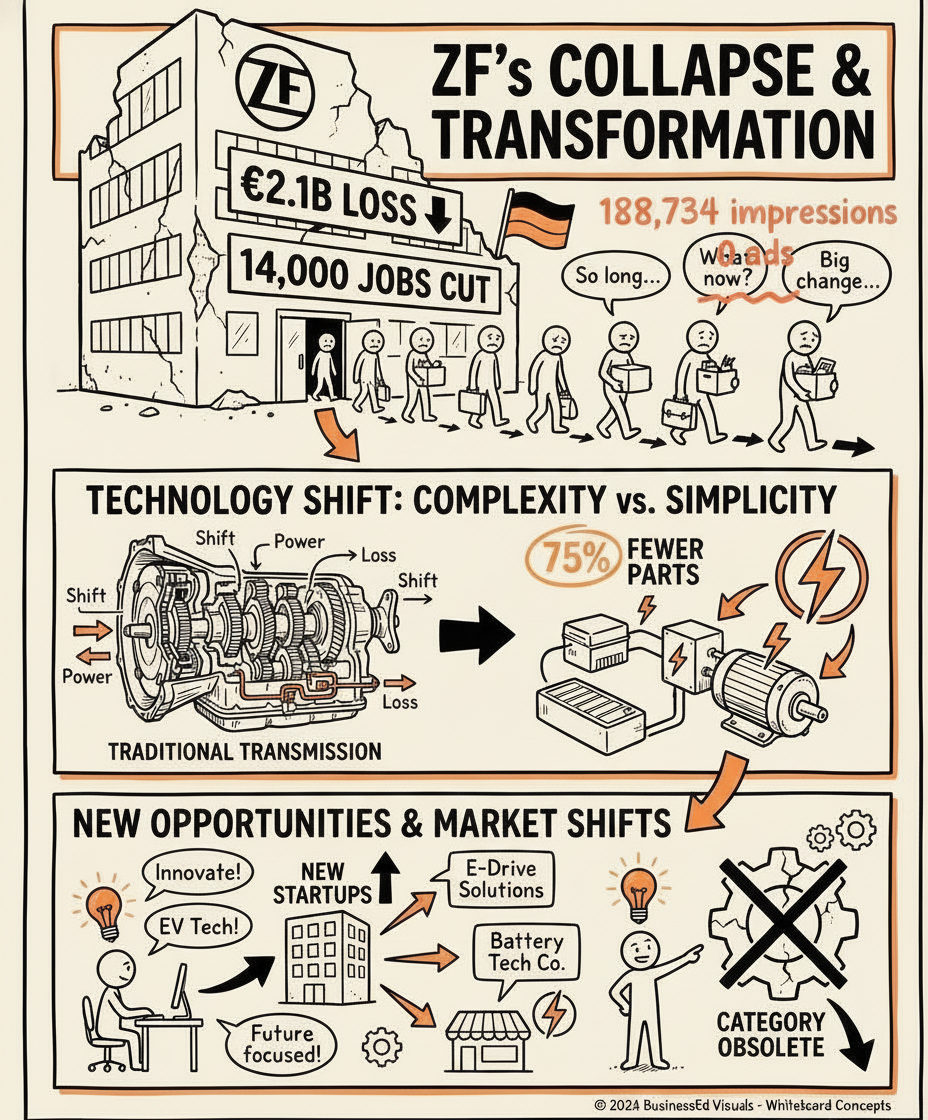
- The hook is one hard, dated fact. "ZF just posted a €2.1 billion loss — 14,000 jobs." A specific number, a concrete consequence, and an emotional payload in a single line. No adjective does any work — the fact does all of it. Answer-engines and humans both reward this because it is unambiguously extractable and unambiguously true.
- The structure is fact → pattern → cause → consequence. One shocking event, then the pattern it belongs to (Bosch, Continental), then the deeper structural why, then what it means for the reader. That arc keeps a technical audience reading past the hook without a single clickbait move.
- The data is named and unhedged. A real company, a real figure, a real jobs number — no "some suppliers may be facing headwinds." Precision is the credibility. The people living it recognise the numbers instantly, and that recognition is what makes them comment and reshare.
- The point of view is earned, not borrowed. "I spent years inside the German automotive supply chain." Insider authority beats outside analysis every time — it is the difference between commentary a VC scrolls past and commentary an OEM buyer forwards to their team.
- The restraint is the multiplier. No link in the body, no CTA, no "DM me." Pure value, let recognition do the work — the funnel link lives in the first comment. A post that asks for nothing gets shared; a post that sells gets skipped.
Virality on engineering-grade content is not volume or luck. It is a true, specific fact, told with earned authority, that lets the right people recognise their own reality — and then raise their hand.
The recipe: recreate this for your industry
This is the copy-paste part. Drop these prompts into Gemini or Claude, swap in your sector, and you have the same structure working for your own pipeline. The visual step is where most people leave value on the table — do not skip it.
- Find the story. "You are an industry analyst in [my sector]. List 5 recent events where a dominant incumbent posted a shocking first — record loss, biggest-ever layoff, a restructured or spun-off division, a written-off platform. For each: the hard number, the date anchor, and why an insider would find it significant. Rank by how many people in the industry would recognise it instantly."
- Write the hook. "Turn event #1 into a single opening line: one hard number, one concrete consequence, under 12 words, zero adjectives. Give me 5 variants."
- Build the post. "Write a LinkedIn post using this arc: shocking fact → the pattern it belongs to (name 2 more real examples) → the structural cause → what it means for [my ICP]. First person, insider POV ('I spent years in…'), named data, no hedging, no CTA, no link in the body. 180–220 words."
- Make the visual value drip. "Here is a screenshot of the source report/headline. Using image editing, annotate it like a marked-up page: circle the key number in coral, hand-draw an arrow to the second data point, add one short margin note in my handwriting-style font. Keep it looking real and captured, not like a slick data-viz card." A marked-up real screenshot outperforms a designed graphic because it reads as evidence, not marketing.
- Place the funnel link in the first comment — never the body — with your UTM parameters, so the reach compounds into tracked pipeline instead of leaking away.
Where this sits
The way to win in a market under this much pressure is to say the true thing clearly and let the people living it raise their hands — then work the ones who do. The full structural story behind the wave is in why German auto suppliers are losing money, and one of its clearest moves gets its own breakdown in the Continental automotive spin-off, explained. If you sell into the industry specifically, see GTM for automotive-software founders.
FAQ
Why did ZF book a €2.1 billion loss?
ZF reported a net loss of around €2.1 billion for fiscal 2025, driven largely by one-off write-downs on unprofitable projects. But the write-downs are the symptom of a deeper squeeze: a high-fixed-cost supplier losing combustion volume while funding an expensive shift to lower-margin electric and software products, with European OEM output falling at the same time.
How many jobs is ZF cutting, and by when?
Up to around 14,000 jobs in Germany, concentrated in the transmission workforce, phased in over the rest of the decade to roughly 2030. It is a structural, multi-year wind-down tied to declining combustion driveline demand — not a single redundancy round.
Which suppliers are next in the restructuring wave?
The wave follows structure, not brand. The most exposed are high-fixed-cost tier-1s whose margin came from combustion-era volume, facing lower-margin electric/software replacements and rising Chinese competition — the same profile that produced Bosch's first loss since 2009 and Continental's automotive spin-off.
What does it signal for companies selling into automotive?
Buying criteria shift from adding features to taking out cost. Suppliers in restructuring pay for provable cost-out, speed and leverage — and they reward evidence over pitch. Reposition around outcome, not incremental features.
More on the engine behind this content: the loop — ingest, publish, mine, extract, reconcile, re-steer. One flat price, we ran it on ourselves first.