There is one number that tells you where the automotive supply chain is headed, and it is not a quarterly loss or a single plant closure. It is a headcount forecast. CLEPA — the European Association of Automotive Suppliers — has warned that a "polycrisis" of slow EV adoption, Chinese competition, carmaker price pressure and regulatory fragmentation threatens up to 350,000 European supplier jobs by 2030. That is not a layoff at one company. It is the shape of an entire sector contracting on a curve you can already trace.
I spent years inside the German automotive supply chain before I left to build a company, and the headcount forecast is the metric I trust most, because it is the one that is hardest to spin. A supplier can restructure a balance sheet, spin off a division, or word a press release carefully. It cannot hide where the people go. What follows is the honest version of the contraction curve — where the forecast comes from, which sub-sectors and regions carry the exposure, and what a shrinking headcount signals for anyone whose revenue depends on this supply chain.
Where the 350,000 figure comes from
The number is CLEPA's, reported across the trade press in early 2026, and the honest caveat matters: it is a sector-wide risk figure for the European supplier base, not a headcount that is guaranteed to vanish, and not a German-only total. Forecasts from other bodies frame the same shift on different scopes — the VDA has warned of further six-figure job losses in the German car sector over the coming decade, and Prognos has modelled combustion-transition losses in the hundreds of thousands through 2035. The scopes differ, but every credible forecast points the same direction and lands in the same order of magnitude.
- Slow EV adoption. The bridge from combustion volume to electric volume is taking longer than the cost base was built to survive — so the transition period, where suppliers fund two worlds at once, stretches out.
- Chinese competition. Faster-moving, lower-priced competitors take share exactly in the electrified and software-defined lines that were meant to replace combustion revenue.
- OEM price pressure and regulatory fragmentation. Carmakers push cost down onto the tier while the rules keep shifting — so suppliers absorb margin compression and compliance churn simultaneously.
A headcount forecast is not a prediction of one bad year. It is the sound of a business model built for a world that is ending, sizing itself down to the world that is arriving.
Which sub-sectors carry the exposure
The contraction is not evenly spread, and pretending it is misreads the whole thing. The jobs at risk are concentrated in the combustion-era hardware that carried the most headcount and now faces the least future demand: powertrain, transmission, exhaust, injection, the mechanical component lines built around the internal combustion engine. That is where the people are, and that is where the demand is falling fastest.
The uncomfortable part is that even the winners shed headcount. Electrified and software-defined product lines are growing, but they employ fewer people per unit of revenue and demand different skills. A battery or software line does not re-employ a transmission plant one-for-one. So the contraction curve is not just "bad suppliers fail" — it is a structural fall in how many people the sector needs, even as its best companies come through the transition intact.
Most exposed — combustion hardware: powertrain, transmission, exhaust, injection
The catch — electrified/software lines grow, but employ fewer people per € of revenue
One contraction curve · concentrated by sub-sector · concentrated by region.
This is the exact framing that, posted plainly on LinkedIn, resonated hard across the industry — because the people living it recognised the curve immediately. It was not the reach that mattered; it was that the right people saw their own reality named in a single number.
Which regions carry the exposure
Geography compounds the sub-sector concentration. The exposure clusters where combustion supply is the local economy: Baden-Württemberg and Bavaria in Germany, and the mono-industrial towns across Central and Eastern Europe whose entire employment base is a single supplier plant. Where a region's jobs concentrate in one combustion-era product line, the contraction is not a rounding error on a national statistic — it is the town.
That is the part a single sector-wide number hides. "350,000 across Europe" sounds diffuse and survivable at the level of a continent. At the level of a Baden-Württemberg town whose largest employer makes injection systems, the same curve is existential. The headline figure understates the local shock precisely because it averages a very concentrated pain across a very large base.
What the contraction curve signals for anyone selling into automotive
If your revenue touches this industry — tools, software, services, talent — a headcount forecast is not background news. It is a spending forecast, because headcount and budget move together. A shrinking supplier buys differently.
- Budgets shift from "add capacity" to "take out cost." A supplier managing down its headcount will not pay for incremental capacity. It will pay for provable cost-out, automation of manual work, and leverage. Reposition around that or get cut.
- Buying cycles slow and scrutiny rises. Every purchase inside a contracting business gets questioned harder and signed slower — except the ones that visibly remove cost, which can move fast because the pain is urgent. Knowing which is which is the whole game.
- Proof beats pitch. Buyers under headcount pressure discount claims and reward evidence. "We removed X hours of manual work on a real engagement, here is the number" outperforms any feature list.
This is also why the operators who win attention in this market right now are the ones naming the structural truth out loud instead of selling around it. The most-read commentary on the supplier contraction was not a forecast summary from the outside — it was pattern recognition from someone who had sat inside the machinery and could say what the number actually means for the people in it. That is a positioning lesson as much as an industry one.
Selling into a market that's contracting?
The buyers who feel this curve are already in your LinkedIn engagement — reacting to the posts that name their reality. See where you stand — a free, personalized LinkedIn visibility audit + blueprint in your inbox within 48 hours. No card, no call.
Book a call →Why this post landed — the anatomy
The industry story above started as a single LinkedIn post that resonated across the automotive world. It was not luck, and it was not reach-hacking. It followed a repeatable structure that any technical founder can copy to build pipeline and credibility with VCs and OEMs. Here is the teardown.
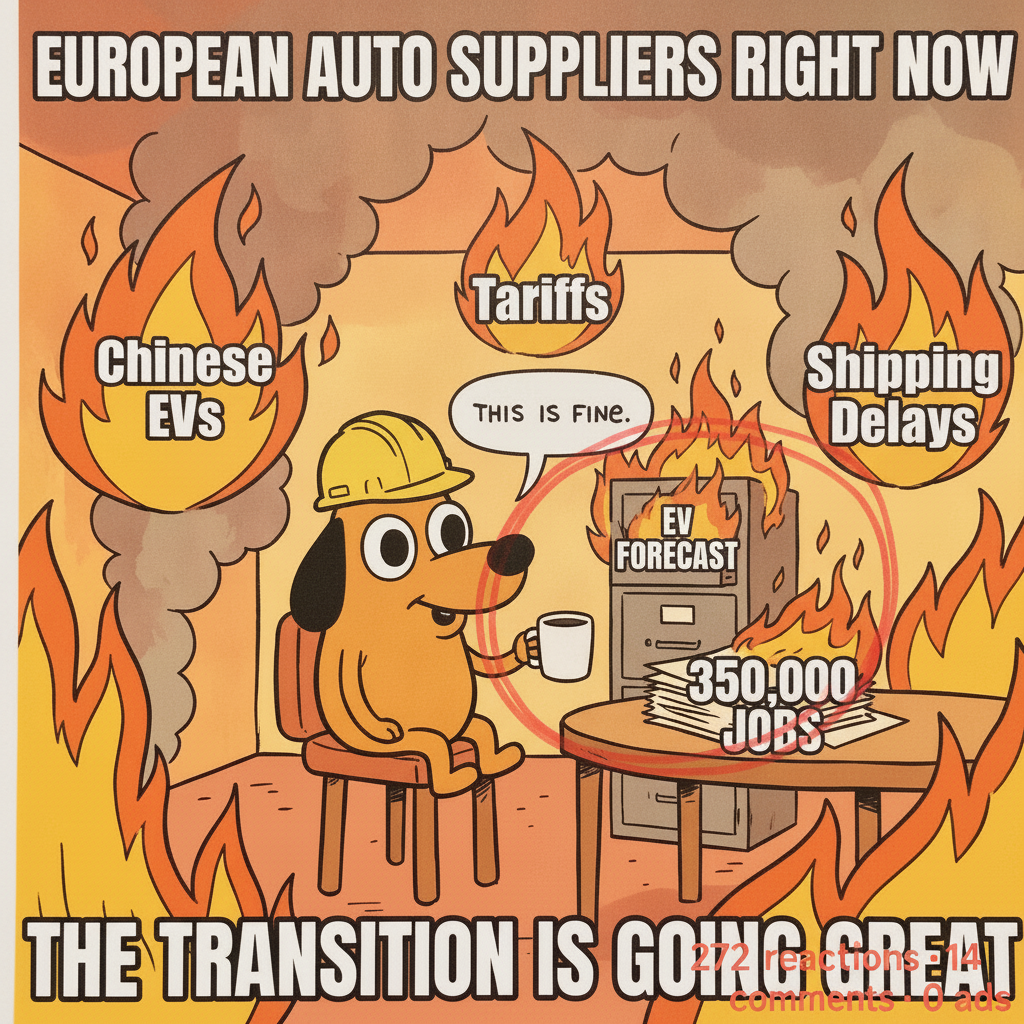
- The hook is one hard, dated fact. "The supplier sector is forecast to lose 350,000 jobs by 2030." A specific number, a verifiable date anchor, an emotional payload — and it is attributed, so it survives scrutiny. Answer-engines and humans both reward this because it is unambiguously extractable and checkable.
- The structure is forecast → pattern → cause → consequence. One hard number, then the pattern it belongs to (sub-sectors, regions), then the structural why, then what it means for the reader. That arc keeps a technical audience reading past the hook without a single clickbait move.
- The data is named, attributed and unhedged on direction. CLEPA, VDA, Prognos — real bodies, real figures, and an honest caveat about scope. Naming the source and its limits is the credibility. The people living it recognise the number instantly, and that recognition is what makes them comment and reshare.
- The point of view is earned, not borrowed. "I spent years inside the German automotive supply chain." Insider authority beats outside analysis every time — it is the difference between commentary a VC scrolls past and commentary an OEM buyer forwards to their team.
- The restraint is the multiplier. No link in the body, no CTA, no "DM me." Pure value, let recognition do the work — the funnel link lives in the first comment. A post that asks for nothing gets shared; a post that sells gets skipped.
Resonance on engineering-grade content is not volume or luck. It is a true, specific, attributed number, told with earned authority, that lets the right people recognise their own reality — and then raise their hand.
The recipe: recreate this for your industry
This is the copy-paste part. Drop these prompts into Gemini or Claude, swap in your sector, and you have the same structure working for your own pipeline. The visual step is where most people leave value on the table — do not skip it.
- Find the story. "You are an industry analyst in [my sector]. List 5 recent forecasts where a credible body put a hard number on the sector's future — a headcount forecast, a demand cliff, a capacity cut, a written-off platform. For each: the hard number, the date anchor, the source, and why an insider would find it significant. Rank by how many people in the industry would recognise it instantly."
- Write the hook. "Turn forecast #1 into a single opening line: one hard number, one date anchor, under 12 words, zero adjectives. Give me 5 variants."
- Build the post. "Write a LinkedIn post using this arc: hard forecast → the pattern it belongs to (which sub-sectors, which regions) → the structural cause → what it means for [my ICP]. First person, insider POV ('I spent years in…'), named and attributed data with an honest scope caveat, no hedging on direction, no CTA, no link in the body. 180–220 words."
- Make the visual value drip. "Here is a screenshot of the source report/headline. Using image editing, annotate it like a marked-up page: circle the key number in coral, hand-draw an arrow to the second data point, add one short margin note in my handwriting-style font. Keep it looking real and captured, not like a slick data-viz card." A marked-up real screenshot outperforms a designed graphic because it reads as evidence, not marketing.
- Place the funnel link in the first comment — never the body — with your UTM parameters, so the reach compounds into tracked pipeline instead of leaking away.
Where this sits
The contraction curve is the forecast; the mechanics underneath it are a separate story. Why the tier is posting the losses in the first place is in why German auto suppliers are losing money, and how the sector is actually restructuring — the moves behind the headcount — is in automotive supplier restructuring in 2026. The mechanics of turning industry recognition into pipeline are in turning LinkedIn engagement into B2B pipeline. If you sell into the industry specifically, see GTM for automotive-software founders.
FAQ
How many auto supplier jobs are forecast to be lost by 2030?
CLEPA warns that a "polycrisis" of slow EV adoption, Chinese competition, OEM price pressure and regulatory fragmentation threatens up to 350,000 European supplier jobs by 2030. It is a sector-wide risk figure for Europe, not a German-only or single-company total — but Germany carries a disproportionate share.
Which supplier sub-sectors are most exposed?
Combustion-era hardware — powertrain, transmission, exhaust, injection and mechanical component lines. They carry the most headcount and the least future demand. Electrified and software lines grow but employ fewer people per euro of revenue, so the sector needs fewer people even as its best firms survive.
Which regions are most exposed?
The combustion-supplier clusters — Baden-Württemberg and Bavaria, and the mono-industrial towns across Central and Eastern Europe built around a single plant. Where employment concentrates in one combustion line, the contraction is the town's economy, which is why the headline number understates the local shock.
What does the forecast signal for companies selling into automotive?
A headcount forecast is a spending forecast. Budgets shift from adding capacity to taking out cost, buying cycles slow and get scrutinised, and every purchase must prove it removes cost or replaces manual work. Reposition around efficiency, provable outcome and leverage.
More on the engine behind this content: the loop — ingest, publish, mine, extract, reconcile, re-steer. One flat price, we ran it on ourselves first.